WordOps General Operations
We use WordOps to manage WordPress/WooCommerce instances. See our WordOps handbook for general operations.
Debugging
The first thing you should you is to enable WP_DEBUG (disabled by default), and also configure sub-options WP_DEBUG_LOG and WP_DEBUG_DISPLAY so you have better control over these options separately. Edit wp-config.php:
define( 'WP_DEBUG', true );
define( 'WP_DEBUG_LOG', true );
define( 'WP_DEBUG_DISPLAY', true );
Reference: Debugging in WordPress
Debugging Plugins
There are many debugging plugins for WordPress that show more information about the internals, either for a specific component or in general. Here are some examples:
Performance
WordOps Dashboard (Netdata)
First of all we can use WordOps Dashboard (based on Netdata) to check general server metrics. This is useful for knowing the general health/responsiveness of system, even without knowing yet the cause of specific issues.
Install: (should have been automatically installed)
sudo -E wo stack install --dashboard --netdataTo access WordOps dashboard, go to https://server-cname.domain.tld:22222/ . If you lose WordOps Dashboard username & password, reset it using:
sudo -E wo secure --authUse a custom username and an auto-generated strong password.
If you can’t access WordOps dashboard, make sure:
- Amazon Lightsail allows port 22222
- You’ve created a WordOps site (without WordPress) with LetsEncrypt SSL certificate:
export CF_Key=...
export CF_Email=...
sudo -E wo site create server-cname.domain.tld -le --dns=dns_cf- Ensure
/var/www/22222/conf/nginx/ssl.confrefers to the correct SSL certificate, not for other site
Diagnosing Slow Applications / Too Much Resource Consumption
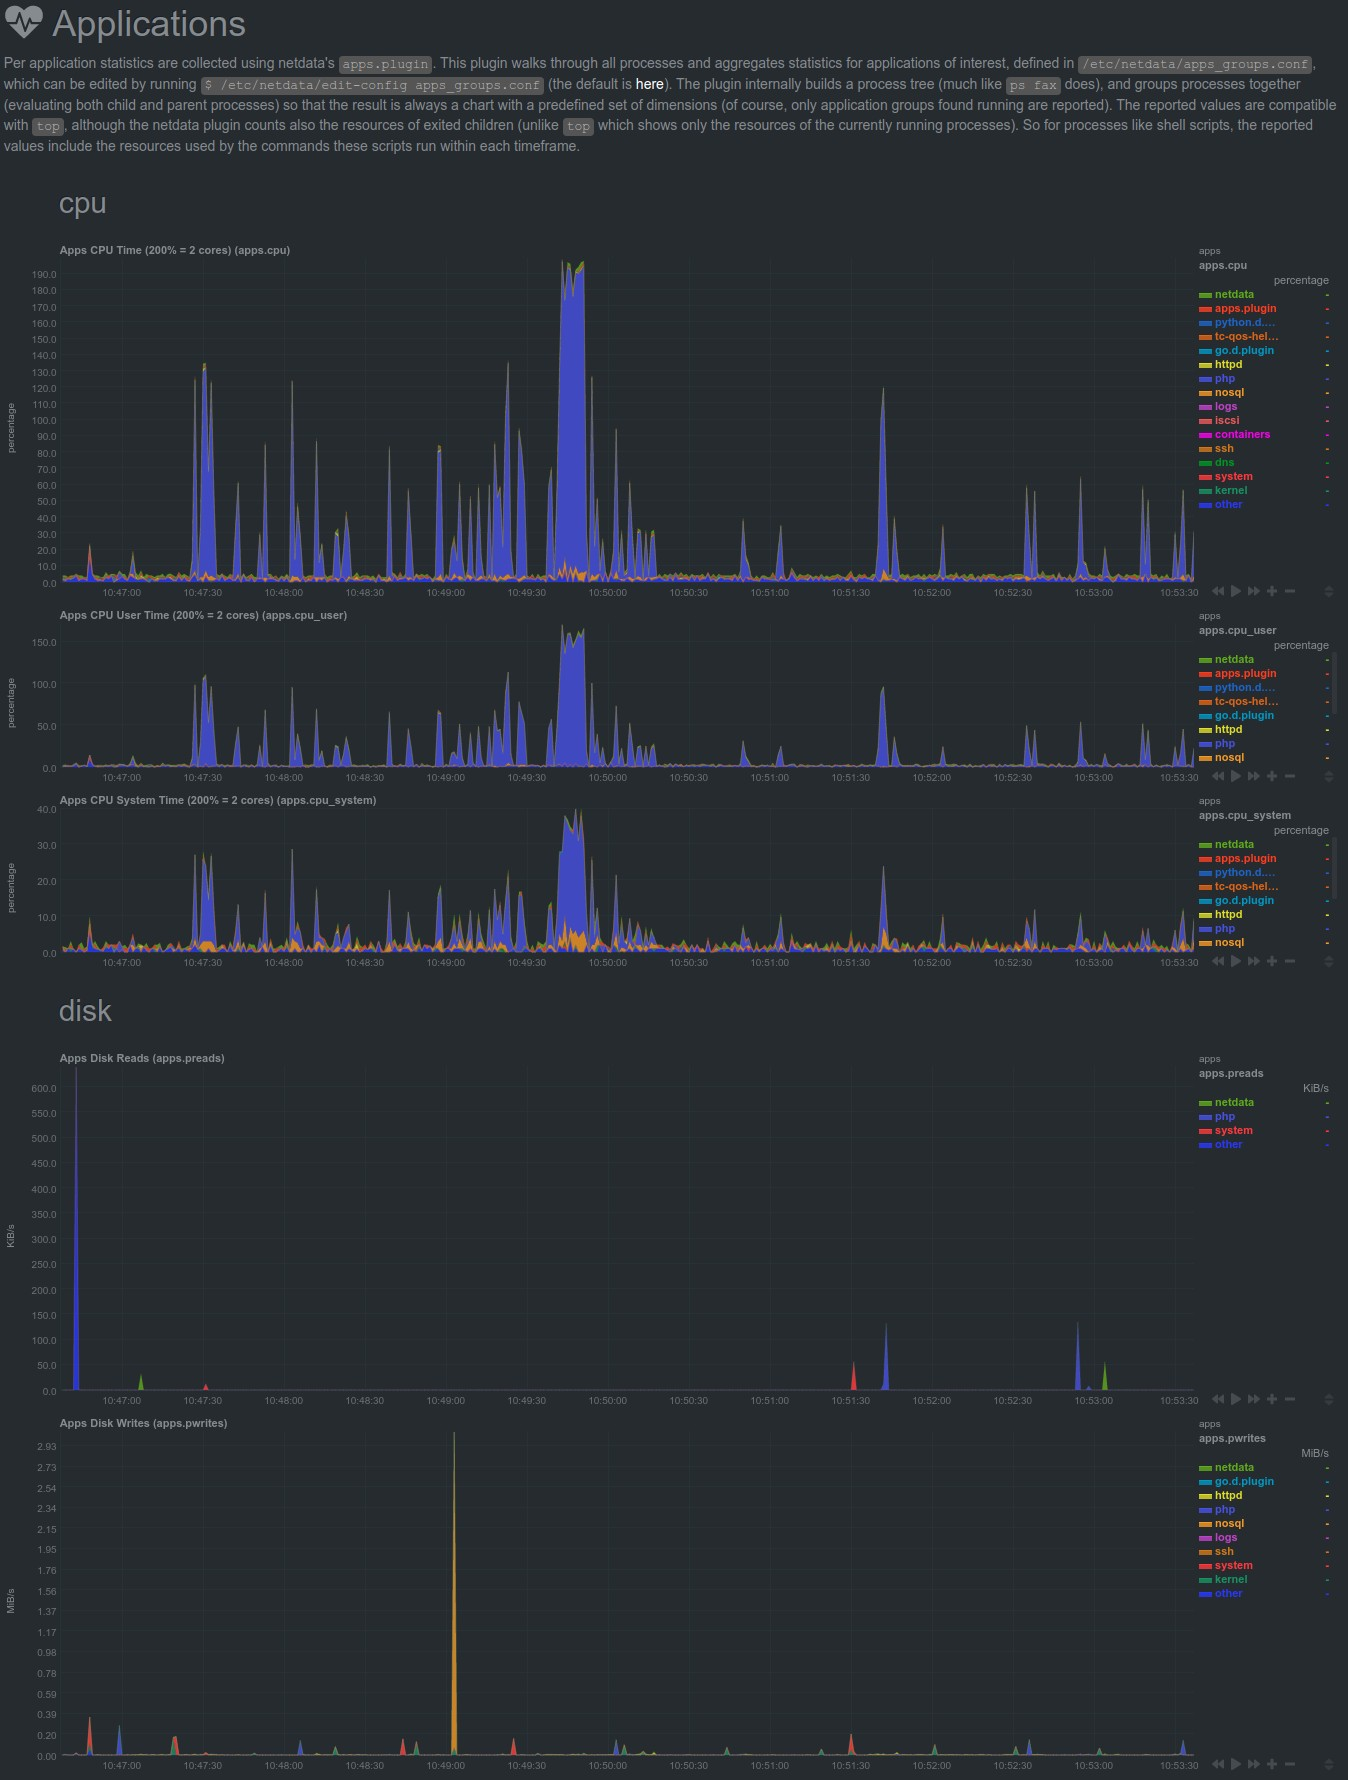
In Netdata, go to Applications. You’ll see CPU usage, disk usage, etc. per application. So now you know the culprit at least on a server level. After you’ve identified the application, you can proceed to diagnose on application level.

Netdata – Applications